 Imagine a toolbox without a hammer.
Medical communicators have toolboxes too. Visuals, such as tables and graphs, belong in that toolbox. We are telling scientific stories, and data are important elements in many of those stories.
Experienced medical communicators are comfortable creating and editing tables and graphs for different audiences and different media.
How do medical communicators learn to present data effectively?
Why Tables and Graphs Are an Essential Skill
Good tables and graphs are essential for successful medical communication. They often convey specific types of information more accurately and efficiently than text. They also add visual interest to the printed page, which engages readers.
Tables and Graphs by Cindy W. Hamilton, PharmD, ELS, is a module in AMWA’s Essential Skills series. In this course, the author shares characteristics of good tables and graphs and helps writers and editors determine when to use tables, graphs, or text to communicate data.
The course also covers the anatomy of tables and graphs, laying the foundation for creating effective tables and graphs and presenting practical tips for constructing them.
The workshop helps medical communicators
- Understand the functions of tables and graphs
- Recognize the basic parts of a table and graph
- Construct a table or graph when given raw data, such as a spreadsheet or in paragraph form
- Identify the strengths and weaknesses in the design of a table or graph and modify it accordingly
- Be familiar with the standard requirements for preparing tables and graphs for submission along with manuscripts
- Be comfortable preparing tables and graphs for posters, slides, regulatory documents, and other special formats
The Difference Between a Table, Graph, and Figure
Let’s start by defining tables, graphs, and figures.
A table is a systematic arrangement of data, usually in rows or columns.
A graph is a diagram that shows relationships, trends, frequencies, or amounts of data.
A figure is a broad term that includes graphs, maps, flowcharts, illustrations, computer‑generated images, and photographs.
Knowing When to Use Tables, Graphs, or Text
Medical communicators use many approaches when choosing the best way to convey information to readers. To determine the best way, it’s often useful to consider the study objective, the message that needs to be conveyed to the reader, and the type of information.
When words suffice, use text. For example, data that can be grouped into categories (qualitative data) can be described with text when the relationships among data are simple and data are few.
When conveying data that can be counted (quantitative data), a table is preferable when displaying exact values. However, a graph is a better way of showing relationships or trends.
Consider this example from Tables and Graphs.
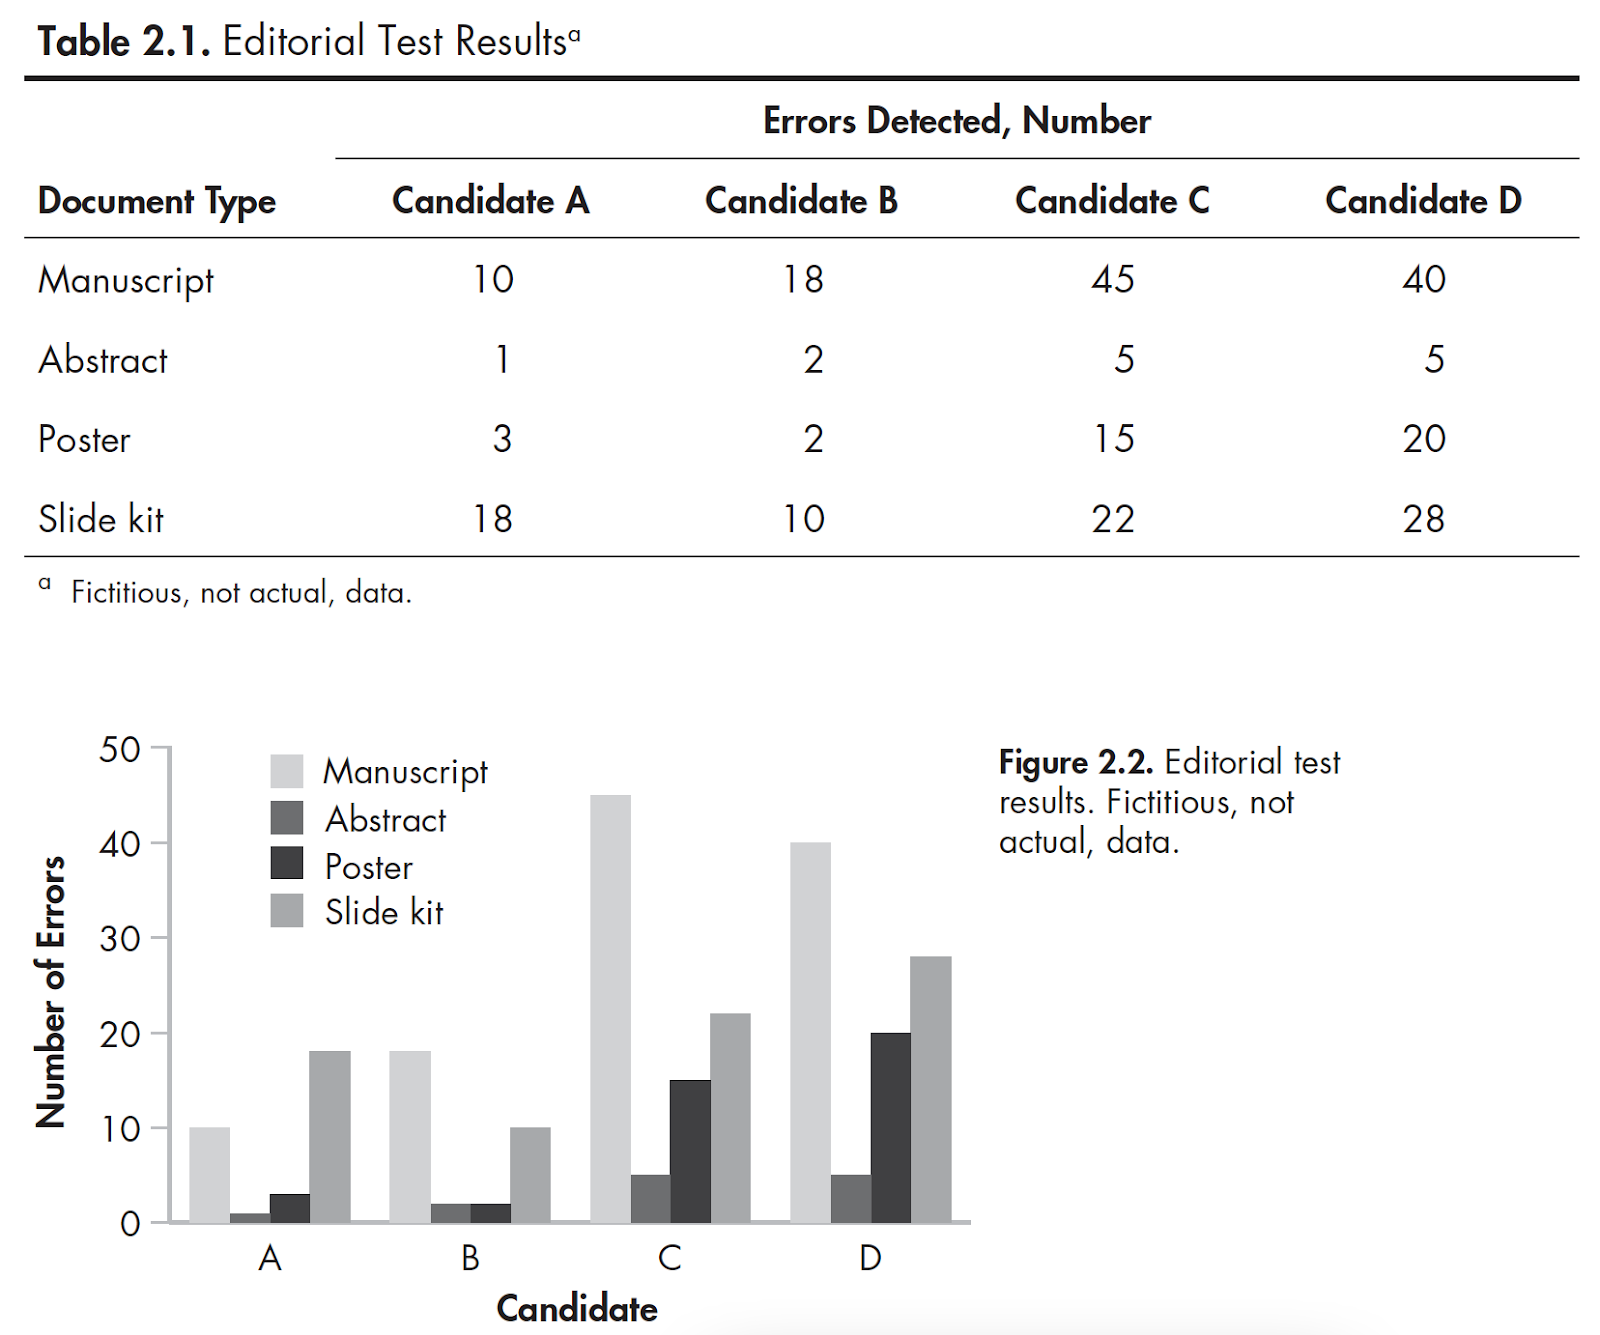
Four candidates for an editorial position took a test and were instructed to identify editorial errors in 4 documents. The manuscript had 50 errors, the abstract had 5 errors, the poster had 20 errors, and the slide kit had 30 errors. The first candidate found 10 errors in the manuscript, 1 in the abstract, 3 in the poster, and 18 in the slide kit. The second candidate found 18 errors in the manuscript, 2 in the abstract, 2 in the poster, and 10 in the slide kit. The third candidate found 45 errors in the manuscript, 5 in the abstract, 15 in the poster, and 22 in the slide kit. The fourth candidate found 40 errors in the manuscript, 5 in the abstract, 20 in the poster, and 28 in the slide kit.
The text is unwieldy and does not allow for easy comparison among candidates.
The following table and graph, however, offer two different ways to present the same data.
From Cindy W. Hamilton, PharmD, ELS, “Tables and Graphs: An Essential
Skills Workshop of the American Medical Writers Association,” p. 8‑9.
The choice between a table and a graph depends on the objective of the information. If displaying the exact results is the goal, the table (Table 2.1) is preferable. If the relationships or trends are more important, the graph (Figure 2.2) serves that purpose.
Different Types of Visual Tools
The National Cancer Institute’s publication, Making Data Talk: A Workbook, presents a visual guide to pie charts, bar charts, line graphs, icons/arrays, visual scales, and data maps, with some valuable tips on when and how to use these elements correctly.
3 Tips for Constructing Good Tables and Graphs
- Adhere to instructions for authors. Instructions can vary widely, so it’s important to submit them according to instructions.
- Adhere to good design principles. Keep tables and graphs simple, concise, and coherent, and omit superfluous design elements.
- Use software judiciously. Many common graphs can be created with word‑processing, accounting, or slide‑making software. However, certain visuals will require specialized graph‑making software or the assistance of a graphic designer.
The Power of Visual Data
Most people have had the unpleasant experience of wading through long, uninterrupted blocks of printed text. Readers have trouble processing some kinds of information, especially numbers, in text.
Medical communicators seeking to optimize their impact are learning the ways to incorporate high‑quality tables and graphs into their toolbox.
An elegantly designed table or graph captures the reader’s attention, clarifies the message, and enhances understanding of the text surrounding it.